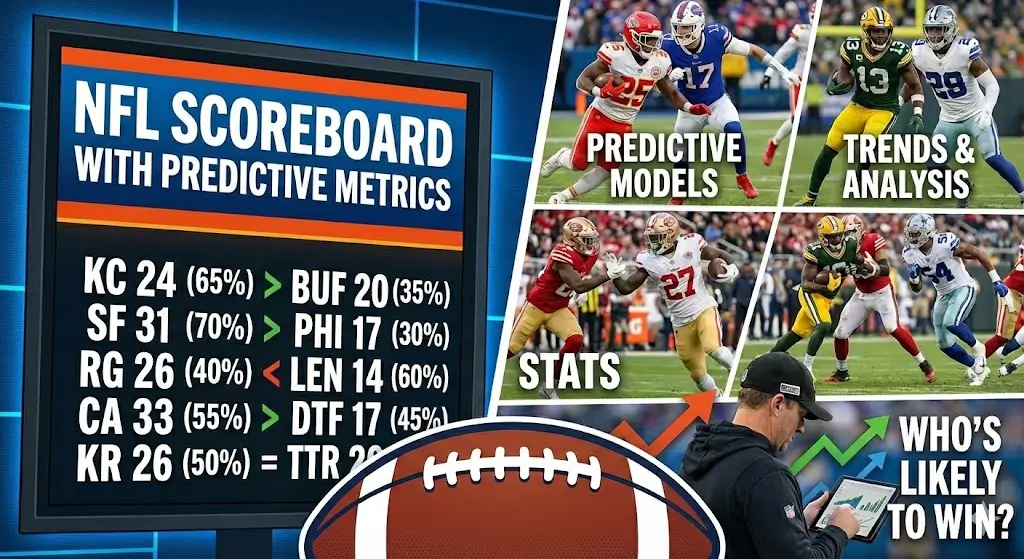
NFL Scoreboard With Predictive Metrics: Who’s Likely to Win?
NFL scoreboard have evolved far beyond basic scores and time remaining. Today, predictive metrics help fans understand which team has the advantage, how momentum is shifting, and who is most likely to win before the final whistle. These advanced tools combine real-time data, analytics, and historical trends to deliver a deeper, smarter look at every matchup.
This guide explains how NFL predictive scoreboards work, which metrics matter most, and how fans can use these insights to track games with greater accuracy and confidence.
Why Predictive Metrics Matter
Football is fast, strategic, and unpredictable. Traditional box scores only reveal part of the story. Predictive metrics fill the gap by analyzing:
- Team efficiency
- Game flow
- Player performance
- Field position
- Coaching decisions
These insights allow fans to see beyond the current score and understand which team has the statistical edge at any moment.
Predictive metrics don’t guarantee outcomes — but they make game analysis smarter, clearer, and more detailed.
1. Understanding Win Probability Models
Win probability models estimate a team’s chances of winning based on real-time data. These models update after every major play.
Factors that influence win probability:
- Score margin
- Time remaining
- Possession
- Field position
- Down and distance
- Turnovers
- Timeouts remaining
For example, a team leading by seven points with the ball in the fourth quarter will have a high win probability. But a turnover or long touchdown can flip the percentage instantly.
Win probability makes the game more exciting by revealing momentum shifts as they happen.
2. Key Predictive Metrics Found on NFL Scoreboards
Modern scoreboards now include advanced analytics that help explain how a game is unfolding. Here are the most important predictive metrics to watch.
Expected Points (EP)
Expected Points measures the value of a team’s field position and down/distance. It predicts how likely a team is to score on a given drive.
A team facing 1st-and-10 near midfield has higher expected points than a team pinned inside its own 10-yard line.
Expected Points Added (EPA)
EPA measures the impact of individual plays. A big pass completion or turnover drastically increases EPA. A negative EPA play — like a sack or penalty — can stall momentum.
Success Rate
Success Rate shows how consistently a team gains the yards needed on each play. Unlike yards per play, it measures efficiency and stability, not just explosive moments.
Pressure Rate
Pressure Rate predicts how effectively a defense can disrupt the quarterback. High pressure often leads to mistakes, turnovers, and lower offensive success.
Red Zone Efficiency
Teams that perform well inside the 20-yard line are more likely to win close games. Red zone efficiency reveals which team capitalizes on scoring chances.
3. How Predictive Metrics Change Throughout the Game
Predictive analytics are dynamic. They shift constantly as the game unfolds.
Early Game
Win probability models are more balanced early, since many scenarios remain possible. EPA, pressure rate, and success rate offer better clues at this stage.
Mid-Game
Patterns start to emerge. Teams with high efficiency on third down or strong defensive pressure begin pulling ahead in predictive models.
Late Game
Win probability becomes extremely reactive. A single play — a fourth-down stop, a long touchdown, or a turnover — can completely change the predicted outcome.
Understanding these shifts helps fans see the strategy behind coaching decisions.
4. How Fans Benefit From Predictive Scoreboards
Predictive scoreboards make the NFL easier to understand for both casual fans and analytical viewers.
Clearer Game Context
Fans get more than just the score. They see how well each team is performing and which areas of the game matter most.
Better Understanding of Momentum
Predictive metrics highlight which team has control, even if the score doesn’t reflect it yet.
Stronger Fantasy Football Insight
EPA, red zone usage, and player performance metrics help fantasy players make smarter lineup decisions.
More Engaging Live Experience
A scoreboard with predictive metrics turns every game into a deeper, more interactive experience.
5. Best Tools for Predictive NFL Scoreboards
Several platforms offer live predictive metrics that update instantly.
ESPN GameCast
Includes win probability charts, drive simulations, and player efficiency breakdowns.
NFL Next Gen Stats
Uses tracking chips in player equipment to measure speed, acceleration, separation, and more.
The Athletic’s Live Models
Provides detailed EPA graphs, play-by-play breakdowns, and matchup insights.
Advanced Analytics Sites
Specialized analytics platforms show predictive charts, drive probabilities, and in-depth game models.
Using these tools together gives fans a complete analytical picture of each game.
6. How Predictive Metrics Enhance Coaching Strategy
Predictive analytics are not just for fans — NFL teams use similar data in real time.
Offensive Strategy
Coaches use metrics to decide:
- When to go for it on fourth down
- When to take deep shots
- When to run down the clock
Defensive Adjustments
Defensive coordinators rely on pressure rate, coverage matchups, and EPA allowed to adjust their game plan.
Clock Management
Predictive models guide late-game decisions involving timeouts, field goals, and play selection.
Predictive analytics help teams make smarter, data-backed choices during critical moments.
Conclusion
NFL scoreboards with predictive metrics give fans a powerful way to understand who’s likely to win — and why. By combining real-time data, efficiency metrics, and win probability models, these scoreboards offer a clearer view of what’s happening on the field.
Whether you’re following one game or tracking the entire Sunday slate, predictive metrics turn every matchup into an insightful, data-driven experience. With the right tools, fans can read the game like an analyst and understand each moment with greater depth and clarity.